
DDR5 tRRD and tFAW Benchmark: 4-6-20 vs 8-8-32 on a 9800X3D
Last tested: September 7, 2026
Do tighter tRRD and tFAW timings make DDR5 faster? We compared a tight 4-6-20 set for tRRD_S, tRRD_L and tFAW against 8-8-32, which is the specification minimum for the x8 DDR5 devices used on consumer DIMMs, on the same Ryzen 7 9800X3D system with a DDR5-6400 kit. We measured CS2 with CapFrameX, plus Cinebench R23, 7-Zip and PYPrime. Short version: CS2 is identical within run-to-run noise, and the looser 8-8-32 set matched or slightly beat 4-6-20 in every synthetic test.
What tRRD_S, tRRD_L and tFAW do
Before a row in a DRAM bank can be read, the bank has to be activated. These three timings limit how quickly ACTIVATE commands can follow each other. Micron's DDR5 datasheet defines them as follows:
- tRRD_S (short): "used for timing between banks located in different bank groups."
- tRRD_L (long): "used for timing between banks located in the same bank group."
- tFAW (four activate window): "Consecutive ACTIVATE commands, which are allowed to be issued at tRRDmin, are restricted to a maximum of four within the time period tFAW."
The same datasheet lists the minimum values for DDR5-5600 to DDR5-6400 in Table 452: tRRD_S at 8 clocks, tRRD_L at the greater of 8 clocks or 5 ns, and tFAW at the greater of 32 clocks or 10 ns for devices with a 1 KB page (x4 and x8 parts, which is what consumer DIMMs use), or 40 clocks or 12.5 ns for 2 KB page x16 parts. At DDR5-6400 a clock is 0.3125 ns, so the clock counts are the binding limits: 8, 8 and 32. That is exactly the 8-8-32 set. The 4-6-20 set sits below the spec minimum on all three timings. Whether the memory controller really issues activations that close together is not visible from Windows, so the only honest way to judge it is to measure.
Test system
All hardware details below are taken from the CapFrameX capture metadata of the runs themselves.
- CPU: AMD Ryzen 7 9800X3D
- GPU: NVIDIA GeForce RTX 5070 Ti, driver 596.49
- Motherboard: ASUS ROG Crosshair X870E Hero
- RAM: 32 GB (2 x 16 GB) DDR5-6400
- OS: Windows 11 Pro build 26200, Resizable BAR on, HAGS on, Windows Game Mode off
Only tRRD_S, tRRD_L and tFAW were changed between the two configurations. Primary timings, voltages, FCLK and the Windows install stayed identical. Each synthetic test was run in the same order for both sets, and CS2 was captured four times per set.
Synthetic benchmarks
| Test | 4-6-20 | 8-8-32 | Difference |
|---|---|---|---|
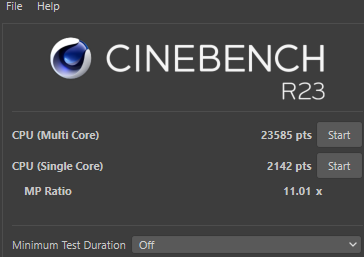
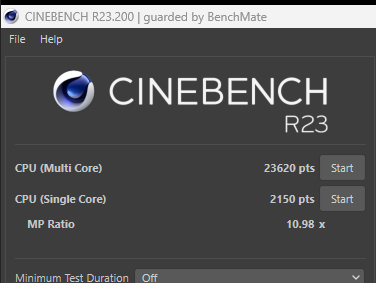
| Cinebench R23 multi-core | 23,585 pts | 23,620 pts | +0.1% for 8-8-32 |
| Cinebench R23 single-core | 2,142 pts | 2,150 pts | +0.4% for 8-8-32 |
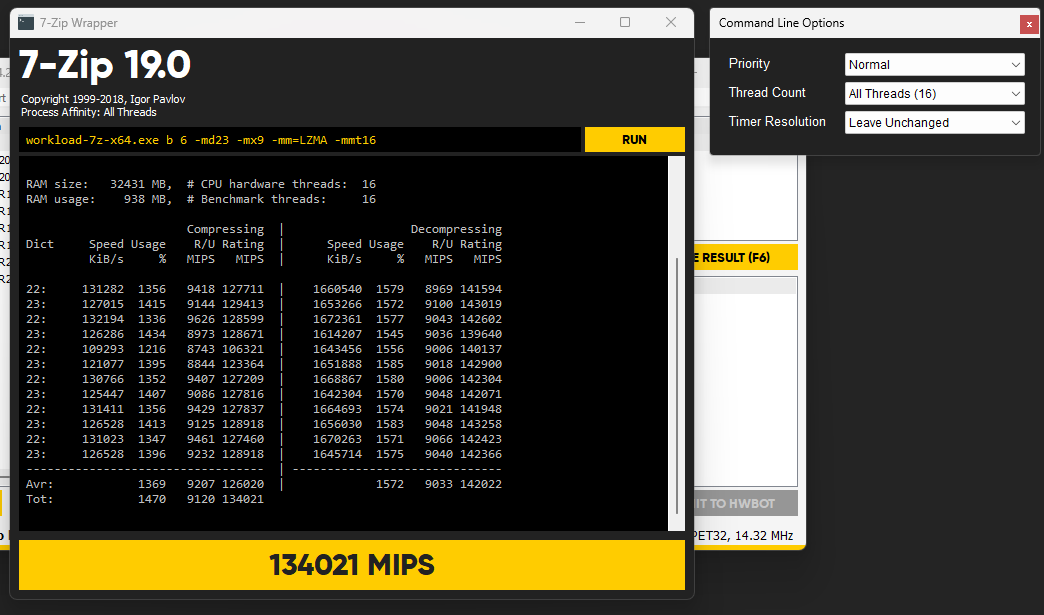
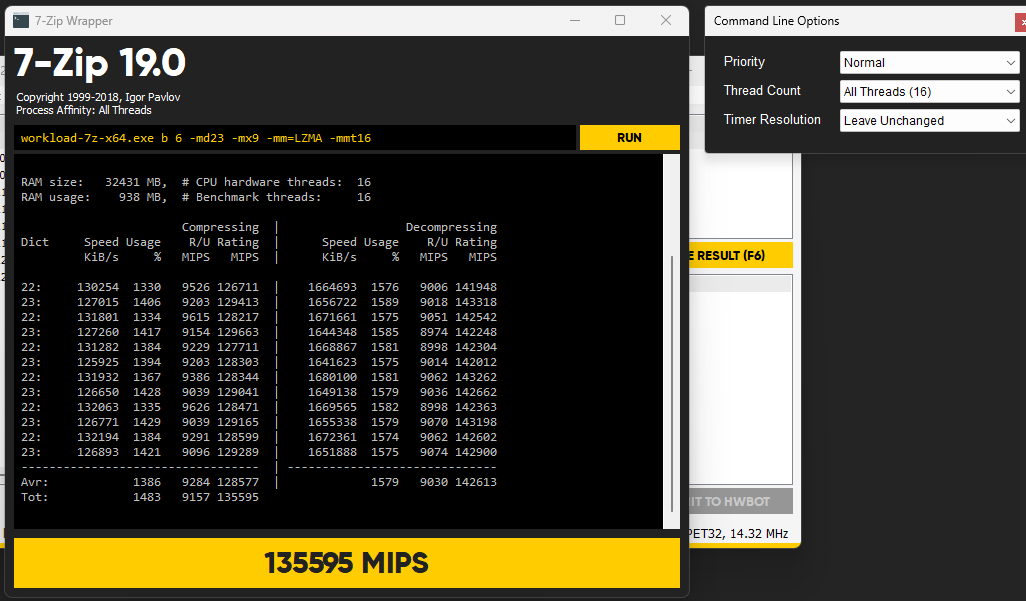
| 7-Zip total rating | 134,021 MIPS | 135,595 MIPS | +1.2% for 8-8-32 |
| 7-Zip compressing | 126,020 MIPS | 128,577 MIPS | +2.0% for 8-8-32 |
| 7-Zip decompressing | 142,022 MIPS | 142,613 MIPS | +0.4% for 8-8-32 |
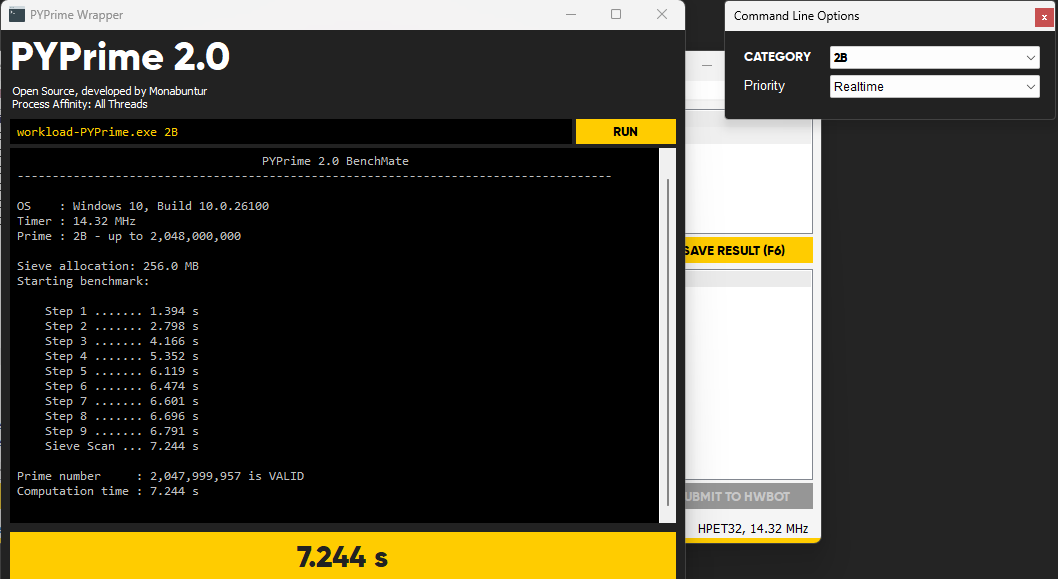
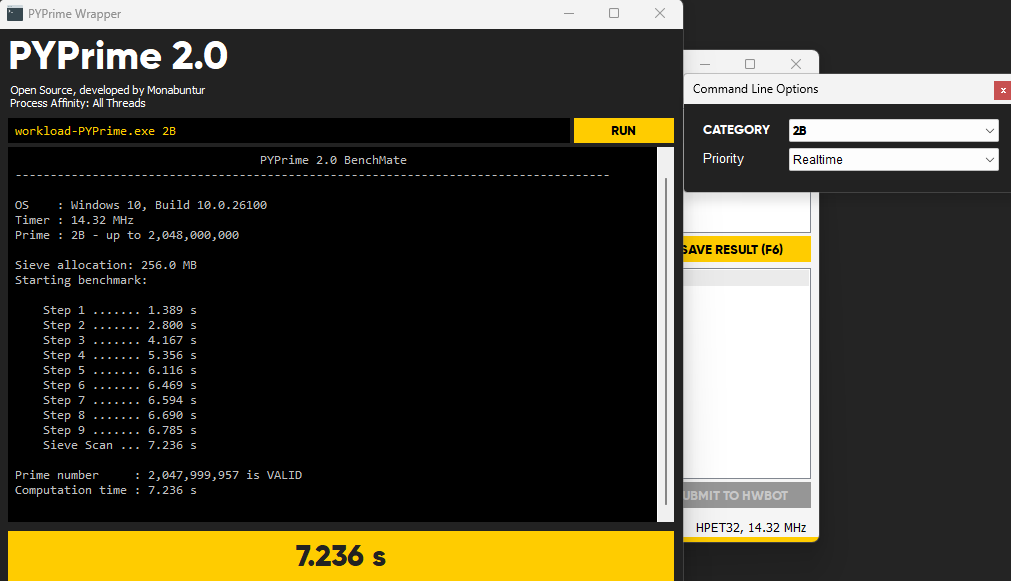
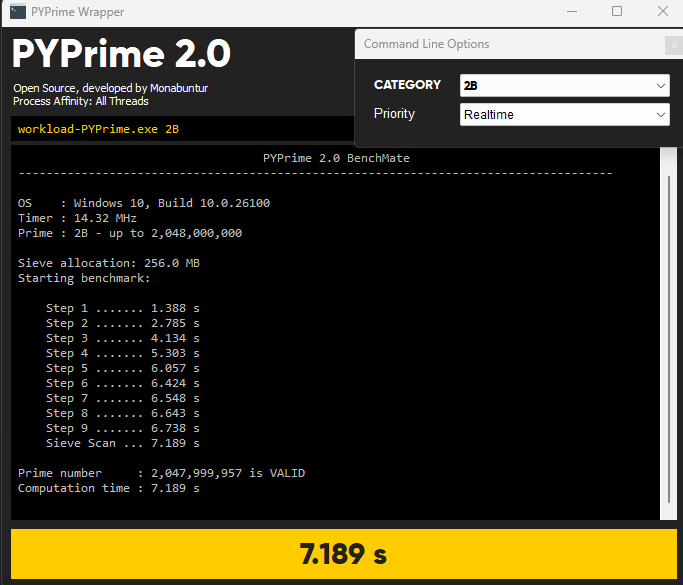
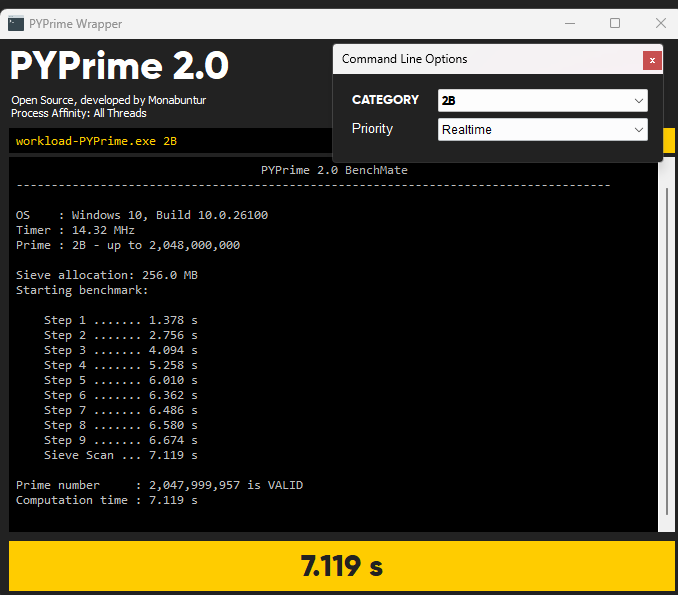
| PYPrime 2B, run 1 / run 2 (lower is better) | 7.244 s / 7.236 s | 7.189 s / 7.119 s | about 1.2% faster for 8-8-32 |
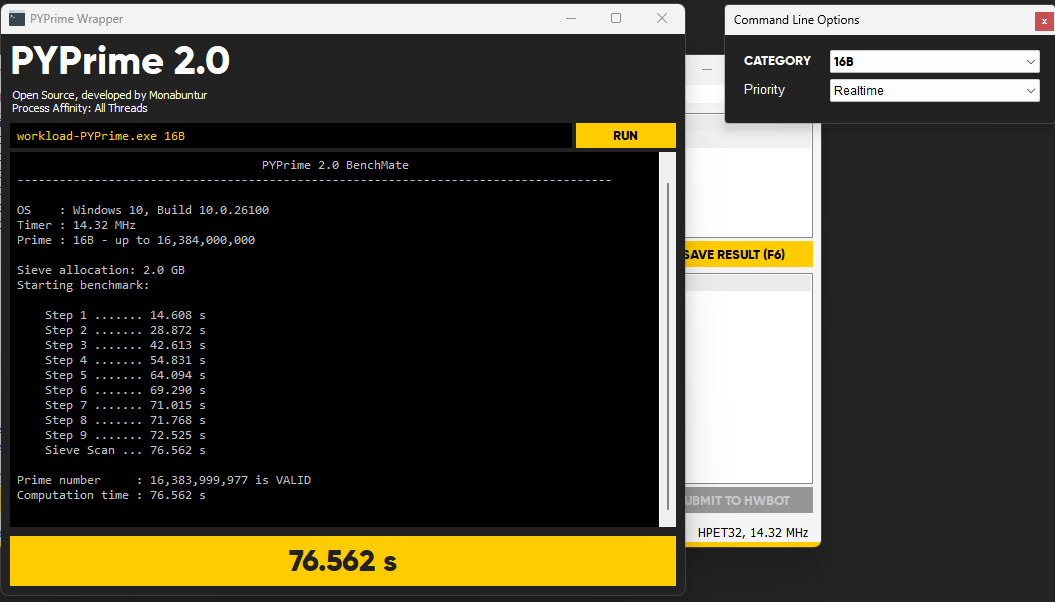
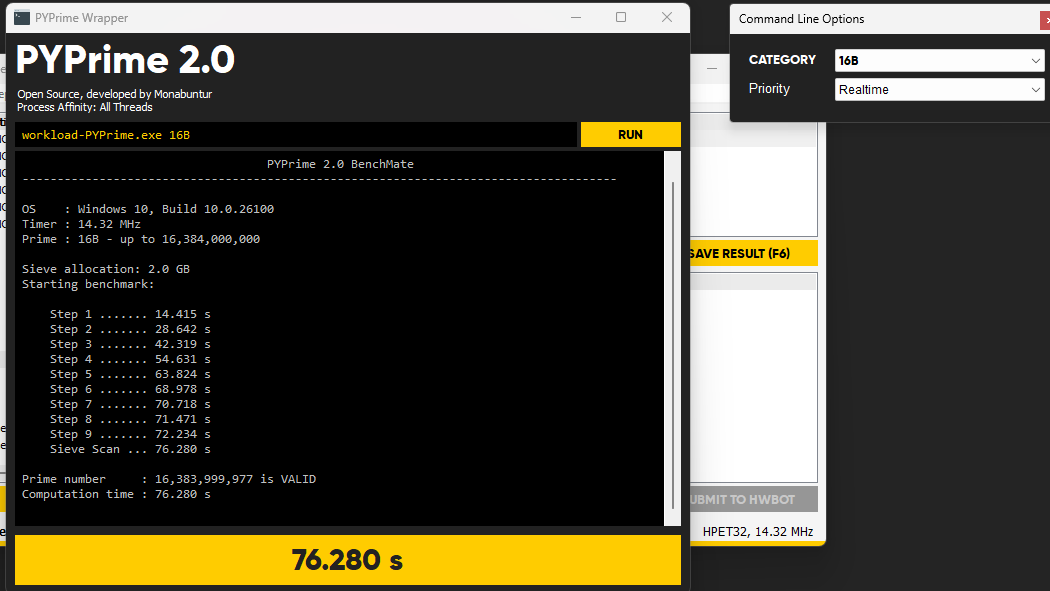
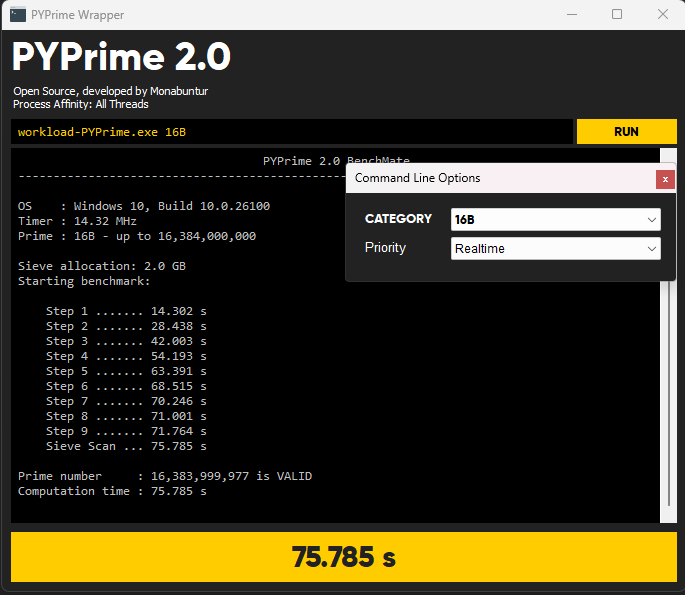
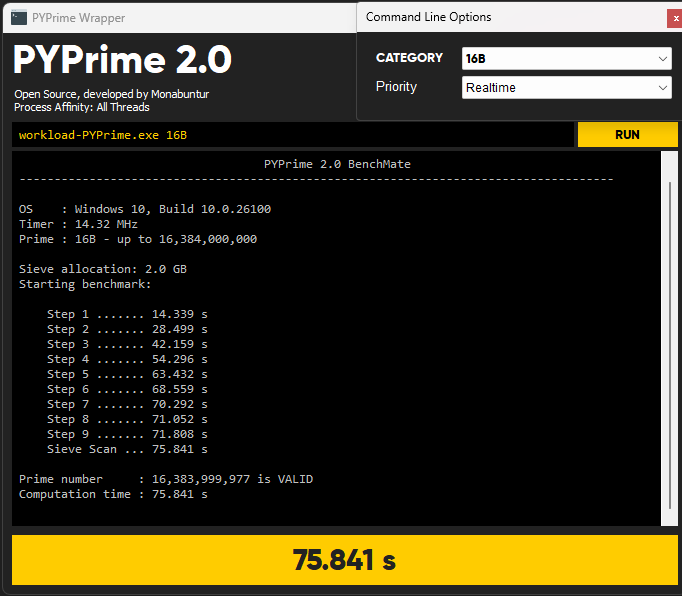
| PYPrime 16B, run 1 / run 2 (lower is better) | 76.562 s / 76.280 s | 75.785 s / 75.841 s | about 0.8% faster for 8-8-32 |
Cinebench R23
Cinebench R23 is Maxon's CPU rendering benchmark, built on the Cinema 4D render engine. It is a processor test first, and the numbers reflect that: 35 points apart in multi-core and 8 points in single-core, both well inside normal variance.
7-Zip
The 7-Zip manual states that compression speed "strongly depends from memory (RAM) latency, Data Cache size/speed and TLB", while decompression "strongly depends on CPU integer operations". That makes the compressing pass the most memory-sensitive part of this test, and it went the other way from what a tighter timing set should do: 8-8-32 scored 2% higher on compressing and 1.2% higher overall.
PYPrime 2B and 16B
PYPrime's own README describes it as a benchmark that "scales well with RAM clock, timings and overall latency, less so with CPU speed", so this is where a real difference would show up. Both runs of both sizes finished sooner with 8-8-32. The gap is small, about 1%, but it is consistent across all four runs.
CS2 benchmark on the 9800X3D
Each configuration was captured four times with CapFrameX, 104 seconds per run and roughly 89,000 frames each. The metrics below were computed from the raw frametimes in the capture files using the formulas in CapFrameX's published source code: average FPS is frame count divided by total time, P1 and P0.1 are the 1st and 0.1th percentiles of the per-frame FPS values, and the 1% low average and 0.1% low average are the average frametime of the slowest 1% and 0.1% of frames, converted to FPS.
4-6-20: four CS2 runs, 104 seconds each
| Run | Frames | Average FPS | P1 | P0.1 | 1% low average | 0.1% low average |
|---|---|---|---|---|---|---|
| 1 | 89,678 | 862.3 | 303.1 | 262.4 | 283.0 | 231.3 |
| 2 | 89,565 | 861.2 | 302.9 | 270.2 | 286.3 | 250.6 |
| 3 | 88,807 | 853.9 | 299.7 | 266.1 | 282.8 | 243.6 |
| 4 | 88,574 | 851.7 | 296.7 | 259.1 | 276.3 | 223.2 |
| Mean | 89,156 | 857.3 | 300.6 | 264.4 | 282.1 | 237.2 |
8-8-32: four CS2 runs, 104 seconds each
| Run | Frames | Average FPS | P1 | P0.1 | 1% low average | 0.1% low average |
|---|---|---|---|---|---|---|
| 1 | 89,060 | 856.3 | 300.6 | 268.1 | 280.7 | 224.4 |
| 2 | 88,767 | 853.5 | 298.8 | 267.7 | 281.8 | 239.7 |
| 3 | 88,791 | 853.7 | 299.0 | 265.7 | 278.9 | 222.9 |
| 4 | 88,615 | 852.1 | 299.1 | 263.8 | 278.5 | 221.8 |
| Mean | 88,808 | 853.9 | 299.4 | 266.3 | 280.0 | 227.2 |
Average FPS lands 0.4% higher with 4-6-20, P1 is 0.4% higher and the 1% low average is 0.8% higher. Each of those gaps is smaller than the spread between individual runs of the same configuration. The 0.1% low average is 4.4% higher for 4-6-20 across the four runs, but look at the per-run values: the 4-6-20 runs range from 223 to 251 and the 8-8-32 runs from 222 to 240, so the two sets overlap and the gap between the means is smaller than the scatter inside either set. CapFrameX's own guidance is that 0.1% values rest on very few frames and change from run to run, which is exactly what these numbers show. Note also that the 4-6-20 averages scatter more: two runs near 862 FPS and two near 852, while the four 8-8-32 runs stay within 4 FPS of each other. In CS2, the two sets are the same.
Conclusion
On this 9800X3D and DDR5-6400 combination, dropping tRRD_S, tRRD_L and tFAW from 8-8-32 to 4-6-20 bought nothing. CS2 was identical within noise, Cinebench did not care, and the memory-sensitive tests, 7-Zip compression and PYPrime, were about 1% to 2% faster with the spec-minimum 8-8-32 set.
Our recommendation: leave these three at 8-8-32. It is the JEDEC-compliant setting: Micron's DDR5 datasheet is marked "JEDEC JESD79-5B compliant" and states that "each speed bin lists the timing requirements that must be supported in order for a given device to be JEDEC-compliant", and 8, 8 and 32 clocks are those requirements for tRRD_S, tRRD_L and tFAW on x8 devices at DDR5-6400 (see the Micron DDR5 SDRAM Core Data Sheet: the compliance bullet on page 1, speed-bin note 10 on page 413, and Table 452 on pages 490 to 491). It removes one variable from stability testing, and it gave equal or better numbers in every test here. Spend the tuning time on the timings that actually move CS2, such as tRFC, tREFI and the primaries, and validate every change the same way, with repeated runs and the low averages, not a single average FPS number.
Related guides:
- TinyBoost: DDR5 and DDR4 memory timings calculator and RAM stress test
- Benchmarking DDR5 6000 MT/s CL26
- AM5 Infinity Fabric – FCLK Overclocking and Stability Testing
- BIOS Tuning Service
Sources
- Micron DDR5 SDRAM Product Core Data Sheet, Rev. D, October 2022: "JEDEC JESD79-5B compliant" in the Features list (page 1); page size per device width, 1 KB for x4 and x8 and 2 KB for x16 (addressing tables, page 33); tRRD_S, tRRD_L and tFAW definitions (ACTIVATE Command section, page 126); DDR5-6400 speed bin (Table 365, page 397) and speed-bin note 10, "each speed bin lists the timing requirements that must be supported in order for a given device to be JEDEC-compliant" (page 413); minimum tRRD_S, tRRD_L and tFAW values for DDR5-5600 to 6400 (Table 452, pages 490 to 491). Page numbers are the ones printed in the datasheet footer and match the PDF page index.
- 7-Zip manual, b (Benchmark) command: what the compressing and decompressing ratings depend on.
- PYPrime 2.x on GitHub: the benchmark's description of what it scales with.
- Maxon on Cinebench: Cinebench as a CPU rendering benchmark built on Cinema 4D.
- CapFrameX: Explanation of different performance metrics and CapFrameX FrametimeStatisticProvider source: definitions and formulas for average FPS, P1, P0.1, 1% low average and 0.1% low average.