f86a90f1-04cf-47e7-a053-87c4c9fb2891

Windows Power Plan Manager

Simple Power Plan Manager

Windows power plans control how your PC balances performance, power draw, heat, and battery life, and a good Windows Power Plan Manager makes them easy to handle without old Control Panel pages or powercfg commands. Managing them the manual way is slow and easy to get wrong. Simple Power Plan Manager is a small, native Windows app that puts every common power plan action in one clean window.

In this guide, we walk through the whole app: viewing installed plans, switching the active plan, importing and exporting .pow files, renaming and duplicating plans, deleting them safely, and restoring missing Windows defaults.

The goal is simple: make the everyday power plan workflow faster and clearer, without forcing you to memorize commands or dig through nested Windows menus.

Important: Simple Power Plan Manager only changes the plans you tell it to. It never silently alters your hardware settings. Every switch, export, rename, and delete is an action you click.

Backup note: Before making bigger changes, use Export All to save every plan as a .pow backup. A backup is your one-click route back to a known-good setup, especially before deleting plans or restoring defaults.

What Is a Windows Power Plan?

A power plan is a saved collection of hardware and system settings, such as display and sleep timeouts, processor power states, USB behavior, and PCIe power management. Windows uses the active plan to decide how aggressively your PC chases performance versus how much it tries to save power.

Many people keep several plans: a balanced profile for everyday use, a high performance profile for gaming or heavy work, and a low-power profile for quiet operation or battery life. The plans themselves are useful. The friction is in managing them, and that is exactly what a dedicated Windows Power Plan Manager removes.

Reminder: After a Windows reset, driver update, or on trimmed-down systems, default plans like High performance or Ultimate Performance can be missing entirely. Simple Power Plan Manager can bring them back.

You can also download our optimized AMD and INTEL power plans from here.

Power Plan Terminology

Power Plan

A saved bundle of power and performance settings that Windows applies as a single profile. Switching plans changes how your hardware behaves without touching each setting individually.

Active Plan

The plan currently in effect. In the app it is clearly tagged ACTIVE in green, so you always know which profile Windows is running.

GUID

The unique identifier Windows assigns to every power plan. The app shows the GUID of the selected plan, which is useful when scripting or matching plans across machines.

.pow File

The standard Windows export format for a single power plan. Export creates one; import loads it back in. It is ideal for backups or sharing a tuned profile with another PC.

Default Plans

The built-in Windows plans: Balanced, High performance, Power saver, and Ultimate Performance. Some are hidden or absent on certain systems until they are restored.

Duplicate

A copy of an existing plan with a new GUID. Duplicating before tweaking lets you experiment freely while the original profile stays untouched.

Description

A short note attached to a plan. Clear names and descriptions make a long plan list easy to understand at a glance.

Important: The GUID is how Windows truly identifies a plan, not the name. Two plans can share a friendly name but always have different GUIDs. When in doubt, check the GUID shown in the details panel.

Getting the Windows Power Plan Manager App

Download the app from GitHub, here

First Launch

Open the app. The window is split in two: a list of installed plans on the left, and a details panel on the right that shows the selected plan’s name, GUID, description, and available actions. The active plan is tagged ACTIVE in green.

Windows Power Plan Manager main window showing installed plans and the details panel

If you ever change plans outside the app, press Refresh to reload the list from Windows.

Viewing and Activating Plans

Every installed plan is listed the moment the app opens. Click a plan to select it, then look at the right panel for its details and actions.

To switch the active plan, select it and press Activate. There is no Control Panel round-trip. This is the fastest way to hop between a daily, a performance, and a quiet profile.

The actions available for a selected plan are Activate, Duplicate, Activate & Edit, Export, and Delete. The active plan cannot be deleted, which prevents you from removing the profile your system is currently using.

Importing and Exporting .pow Files

Windows plans can be saved as .pow files. Use Import to load one or more tuned profiles straight into Windows, and the Export options to back them up. This is perfect before a reinstall or for sharing a profile.

To import, press Import and select one or more .pow files in the native Windows picker.

To back up everything at once, press Export All and choose a folder. The app writes every installed plan into that folder as a separate .pow file.

Exporting power plans as .pow backup files in the Windows Power Plan Manager

To save just one plan, select it and press Export Selected. The app suggests a sensible file name based on the plan name.

Backup note: Run Export All before any bigger change. If something goes wrong, a quick Import restores your plans exactly as they were.

Renaming, Describing, and Duplicating

Give plans clear names and descriptions so each profile explains what it is tuned for. Select a plan, edit the name and description fields, then press Save to write the changes back to Windows.

Before experimenting with a plan, press Duplicate first. Copying a plan creates a new GUID, so you can tweak the copy freely while the original stays exactly as it was.

Deleting Plans Safely

Plans you no longer need can be removed with Delete, but never by accident. A confirmation dialog names the plan and warns that it will be removed from Windows before anything happens.

Delete confirmation dialog in the Windows Power Plan Manager
Important: You cannot delete the active plan. Activate a different plan first, then delete the one you no longer want. Deleting a plan is permanent, so keep a .pow backup if you might need it again.

Restoring Missing Windows Defaults

If Windows is missing its built-in plans, press Enable Windows Defaults to bring them back. This covers Balanced, High performance, Power saver, and Ultimate Performance. It is handy on fresh installs and trimmed-down systems where some of these are hidden or absent.

Reminder: Export All first. Restoring defaults is a larger operation, so a fresh backup means you can always return to your previous setup if you change your mind.

Recommended Workflow

A safe routine for getting a tidy, tuned setup without risking your current configuration:

  1. Open the app and confirm which plan is currently active.
  2. Press Export All to back up every plan before making changes.
  3. Duplicate a plan if you want to experiment, so the original stays safe.
  4. Rename the copy and add a description so it is easy to identify later.
  5. Activate the plan you want to use.
  6. Use Activate & Edit only when you need Windows’ advanced settings.
  7. Delete leftover test plans you no longer need.

Action Reference

A quick map of every control in the app and what it does:

Action What It Does
Refresh Reloads the plan list from Windows.
Activate Sets the selected plan as the active Windows plan.
Duplicate Creates a copy of a plan, with a new GUID, for safe editing.
Import Loads one or more .pow power plan files into Windows.
Export Selected / All Saves the selected plan, or every plan, as .pow backup files.
Rename / Description Updates the friendly name and description of a plan.
Enable Windows Defaults Restores missing built-in Windows power plans.
Activate & Edit Activates the plan and opens Windows’ advanced power settings.
Delete Removes a plan from Windows after a confirmation prompt.

The Process

The basic workflow for keeping a clean, reliable set of power plans is:

  1. Back up everything with Export All.
  2. Restore any missing defaults you actually use.
  3. Duplicate before tweaking, and rename copies clearly.
  4. Activate the plan you want as your daily profile.
  5. Delete leftover test plans, keeping a .pow backup of anything you might want again.

TL;DR: Export All for safety, Activate to switch in one click, Import to load tuned profiles, Duplicate before experimenting, Enable Windows Defaults to recover missing plans, and Delete what you do not need.

Important: A dedicated Windows Power Plan Manager makes your power plans easier to manage, but it does not replace tuning the rest of your system. For real, end-to-end responsiveness you also want a stable CPU, memory, and BIOS setup.

For CPU-side overclocking and stability testing, read our AM5 Infinity Fabric – FCLK overclocking and stability testing guide, book a BIOS consult and let us do the work for you or join the discord!

NVIDIA GPU overclocking and undervolting with MSI Afterburner

NVIDIA GPU Overclocking and Undervolting Guide

The Ultimate NVIDIA GPU Undervolting & Overclocking Guide

NVIDIA GPU overclocking and undervolting helps you lower voltage, reduce heat, and keep strong performance. In this guide, we tune an NVIDIA GPU with MSI Afterburner, benchmark with Unigine Superposition and 3DMark Steel Nomad, and validate stability in real workloads.

The goal is simple: lower voltage while keeping the same performance, or in some cases gain performance, because the GPU can boost more consistently with less heat and lower power draw.

Important: GPU undervolting and overclocking always depends on your specific graphics card. Do not blindly copy the final values from this guide. Use the process, test carefully, and only keep settings that are stable on your own system.

The screenshots and benchmark numbers in this guide are examples from one RTX 5070 Ti system. Your results can be different depending on your GPU model, cooler, BIOS, driver version, ambient temperature, power limit, case airflow, and the game or benchmark you are testing.

Safety note: Do not enable “Apply overclocking at system startup” until your profile has passed extended testing. Keep a known-good stock or mild profile saved, know where the reset button is in MSI Afterburner, and monitor temperatures, power draw, fan behavior, and stability. Raising power limits, voltage limits, or clocks can increase heat, power draw, noise, and instability.

What Is GPU Undervolting?

GPU undervolting means asking the graphics card to run a specific core clock at a lower voltage.

On NVIDIA GPUs, this is usually done through the Voltage/Frequency Curve Editor inside MSI Afterburner. Instead of only moving the core clock slider, we choose a target voltage point, raise it to our target frequency, and flatten the rest of the curve to the right.

On modern NVIDIA cards, undervolting results depend on silicon quality, cooling, drivers, the active power limit, the temperature limit, and the workload you are testing. During our testing, the same RTX 5070 Ti behaved differently in Superposition, CS2, MSI Kombustor, and 3DMark Steel Nomad. The same curve can produce slightly different delivered clocks in different workloads.

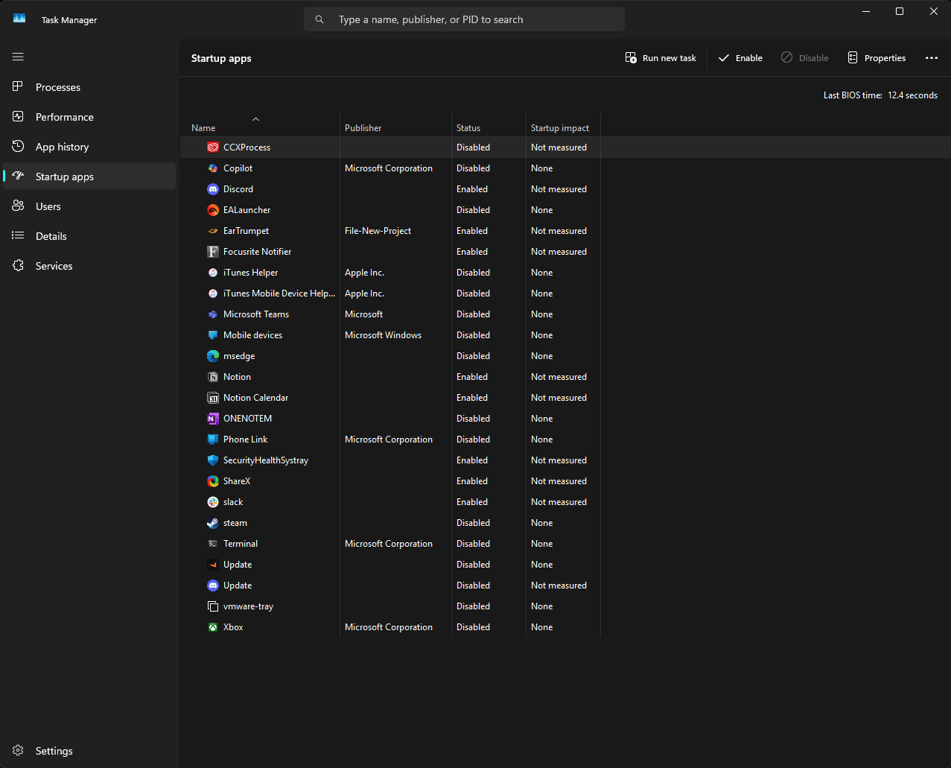
An unstable CPU/RAM overclock, an unstable power profile, aggressive background software, overlays, unstable drivers, or system instability can mimic an unstable GPU undervolt. These problems can cause crashes, score drops, stuttering, or artifacts that have nothing to do with your GPU voltage/frequency curve. Before tuning your GPU, make sure your system is running from a known-stable baseline.

Reminder: Every GPU is different. Your final voltage and frequency will depend on silicon quality, cooling, drivers, power limit, temperature, and the workload you are testing.

GPU Tuning Terminology

Core Clock

The operating frequency of the GPU shader cores. This is the clock you usually watch during games and benchmarks. It changes dynamically depending on load, temperature, voltage, and power behavior.

Core Voltage

The voltage delivered to the GPU core during operation. In MSI Afterburner, the Core Voltage slider is not your undervolt target. Your undervolt target is usually controlled through the VF curve.

VF Curve

The voltage/frequency curve. This is the main tool used for NVIDIA undervolting. It lets you request a specific clock speed at a specific voltage point.

Power Limit

The maximum board power the GPU is allowed to draw. On recent Ada and Blackwell cards, the power limit is the dominant throttle at stock settings.

Temperature Limit

The thermal ceiling the GPU is allowed to reach. If the card gets too hot, boost behavior can reduce clock speed and voltage to keep the GPU inside its allowed operating range.

Memory Clock / Memory Offset

The operating frequency of the GPU’s video memory, or VRAM. In MSI Afterburner, this is usually adjusted as an offset added to the stock memory clock. Higher memory clocks can improve bandwidth, but pushing them too far may cause artifacts, crashes, or instability.

Requested Clock

The clock you ask for in the VF curve or through a core clock offset. This is a target, not a guarantee. The GPU may not always deliver this exact clock under load.

Delivered Clock

The actual clock speed the GPU holds during a game, benchmark, or stress test. This can be lower than the requested clock because of power, temperature, voltage, current, BIOS, or workload behavior.

PerfCap / Limit Reasons

Performance limit indicators that show why the GPU is not boosting higher. Common reasons include power limit, temperature limit, voltage limit, current limit, or workload behavior.

Artifacts

Visual errors such as flashing pixels, texture corruption, strange shapes, or image glitches. Artifacts usually mean the core or memory overclock is unstable.

Score Regression

A benchmark score drop after increasing clocks or lowering voltage. This usually means the profile is not behaving correctly, is hitting a limit, or is unstable even if it does not crash.

Transient Load Changes

Rapid changes in GPU workload, power draw, current, voltage, and clock speed. These can happen during real gameplay and may expose instability that a flat 100% stress test does not catch.

Important: The VF curve is a request, not a guarantee. We request a target voltage and frequency, then the GPU decides what it can actually hold based on silicon quality, workload, temperature, power behavior, current limits, BIOS limits, and driver behavior. Treat the requested point as your starting estimate, not the final result.

Required Tools

Download and install the following tools before continuing. Use trusted download sources only.

Unigine Superposition

Download Superposition

3DMark Steel Nomad

Install 3DMark / Steel Nomad

MSI Afterburner

Download MSI Afterburner

MSI Kombustor

Download Kombustor

Initial MSI Afterburner Setup

Open MSI Afterburner.

Click on the settings menu.

MSI Afterburner main window and settings menu

On the General tab, enable the following options if they are available on your system:

  • Unlock voltage control
  • Unlock voltage monitoring

Press Apply.

MSI Afterburner unlock voltage control and voltage monitoring settings

Go to User Interface and select the skin called MSI Cyborg Afterburner. Press Apply, then press OK.

MSI Afterburner MSI Cyborg skin selection

MSI Afterburner may need to restart. Restart it before continuing.

After MSI Afterburner opens again, check your sliders.

MSI Afterburner core voltage and power limit sliders
Important: The Core Voltage slider is not your undervolt target. Setting Core Voltage to 100% does not mean the GPU is forced to run at maximum voltage all the time. It allows the card to use the voltage range permitted by the GPU BIOS and driver, which can allow higher boost voltage under load and may increase power draw and heat. For a normal undervolt, the voltage target will be controlled later through the VF curve.

Benchmark Setup

Open Superposition. Click Benchmark, then Performance, and copy the settings shown below.

You may need to change the resolution before testing. In this guide, we use a 1080p monitor, so we test with 1080p settings.

Superposition benchmark performance settings

If you have two monitors, place MSI Afterburner on one monitor and Superposition on the other.

Reminder: Superposition scores can be affected by system stability, Windows background applications, overlays, monitoring software, shader cache, driver behavior, and other programs. Before testing, make sure your system is stable and close unnecessary background applications.

Running the Stock Baseline

Start the Superposition benchmark.

During the first scene, look at MSI Afterburner after the clock speed has stabilized. Note down these values during the run:

  • Core voltage
  • Core clock

After the benchmark finishes, note down the final benchmark score.

MSI Afterburner core clock and core voltage during Superposition benchmark

Write these values down on your phone or in a spreadsheet, then wait for the benchmark to finish before recording the final score.

The image below shows our sample RTX 5070 Ti scoring around 15118 points at stock settings.

Stock Superposition benchmark score

During the run, the GPU was clocked around 2860 MHz at 1055 mV.

MSI Afterburner showing 2860 MHz and 1055 mV

For the first undervolt attempt, we will target 1020 mV, roughly 30 mV below the stock voltage we observed. You may want to start higher or lower depending on your GPU, but do not rush the process.

Better testing method: Run your baseline benchmark 2 to 3 times and compare the average score. A single benchmark run can vary. We are looking for repeatable trends, not tiny one-run differences.

Opening the MSI Afterburner Curve Editor

Click on the monitoring graph area inside MSI Afterburner, then press CTRL + F.

Opening MSI Afterburner curve editor with CTRL F

You will now see the Curve Editor.

MSI Afterburner voltage frequency curve editor

On the left side, we see frequency. On the bottom, we see voltage.

We are going to find the voltage point we want, raise it to the frequency we want, and flatten the rest of the curve to the right.

Finding the Target Voltage Point

Look at the bottom of the graph and find 1020 mV. Move your mouse upward from 1020 mV until you see the dot for that voltage point.

If you click on the dot and look on the left, you will see the clock speed highlighted.

In our example, the 1020 mV point is around 2827 MHz, which is a bit lower than what we want. So we need to raise that voltage point on the VF curve.

Click the 1020 mV dot and drag it upward until you see your target frequency. In our example, we want around 2860 MHz.

But we will not aim exactly at 2860 MHz. We will aim around 2880 to 2890 MHz, which is roughly a +30 MHz request. We will explain why we do that later.

This is called a single point undervolt.

MSI Afterburner VF curve target point raised at 1020 mV

Anything prior to this point is left alone. We change the points from our selection and onwards.

Make the VF Curve window smaller and find MSI Afterburner.

Press the Apply button.

MSI Afterburner apply button after raising the curve point

Open the VF curve editor again and find your voltage point. For us, it is 1020 mV.

Now that you have raised the target point, you need to flatten the rest of the points to the right. This limits higher-frequency boost behavior beyond your chosen VF point. It does not hard-lock the GPU to one exact voltage or frequency in every workload, because GPU Boost can still adjust real operating behavior based on power, temperature, current, BIOS limits, and workload.

Focus on the selected dot. Place your cursor between the next points, hold SHIFT, and drag to the right until the rest of the curve points are selected. It will look like this.

Selecting the right side of the MSI Afterburner VF curve

Then click one of the selected dots inside the blue selection.

Clicking selected curve points in MSI Afterburner

Drag the selected points down slightly, then let go of the mouse.

Dragging selected curve points down in MSI Afterburner

Now hold SHIFT and press ENTER two times in a row. The end result will be something like this.

Flattened MSI Afterburner VF curve after undervolting

Applying the First Undervolt

Close the VF Curve Editor and press Apply in MSI Afterburner.

Applying the undervolt curve in MSI Afterburner

On the Core Clock field, you should now see Curve. You have applied your first undervolt.

Retesting in Superposition

Open Superposition and start the test again. Use the exact same benchmark settings as before.

In our first undervolt run, the score increased to 15424 points, roughly 300 points higher than the stock baseline.

Superposition score after first undervolt run

Afterburner reports that our card ran around 2865 MHz with roughly 1020 mV during the run. A small voltage difference can come from voltage-step granularity, polling rate, rounding, or GPU Boost behavior, and is usually not meaningful by itself.

MSI Afterburner showing clock and voltage after first undervolt

Rinse and Repeat

Now repeat the process.

  1. Open MSI Afterburner.
  2. Click the reset button if you want to start from a clean curve.
  3. Set the fans to the same fixed fan speed again for consistent testing.
  4. Open the VF Curve Editor.
  5. Try another voltage and frequency target.
  6. Apply the curve.
  7. Run Superposition again with the same settings.
  8. Write down the score, voltage, and clock speed.
  9. Repeat promising results 2 to 3 times to confirm they are not one-run variation.

For the next test, we tried around 2860 MHz at 1000 mV.

During the test, our GPU is not able to sustain the requested 2860 MHz at 1000 mV.

In this specific run, Superposition cannot maintain what we requested. That may mean the voltage is too low for that target frequency on this card, but it can also mean the card is hitting a power, current, temperature, BIOS, or workload-related limit. Check your limit reasons and test carefully before assuming voltage is the only cause.

MSI Afterburner curve and benchmark behavior at 1000 mV

To recover, we can add 10 or 20 mV and retest, or lower the target frequency slightly, then check whether the card can maintain the target more consistently.

Running a Kombustor test to see if 1000 mV is enough for 2860 MHz can point us in the same direction, but it is still only one workload. If the card cannot hold the target there either, increasing voltage slightly or lowering the target clock is usually the next step.

MSI Kombustor test showing undervolt behavior at 1000 mV
Do not overreact to small score changes. A small score difference can be normal benchmark variation. Large drops, repeated lower averages, artifacts, crashes, or driver resets matter much more than a tiny one-run difference.

The Important Caveat: Requested vs. Delivered Frequency

Even though you have set a target point on the VF curve, your actual clock speed may be slightly lower during a benchmark or game.

This happens because when we edit the VF curve, we request a target. We do not force the GPU to hold that exact number in every workload. The GPU still chooses what it can actually hold based on silicon quality, workload, temperature, power behavior, current limits, BIOS limits, and driver behavior.

To explain it simply: just like a CPU can drop voltage and frequency during a heavy stress test, the same rule can apply to a GPU. A heavy workload may cause the card to run slightly below the requested VF point.

Important: Do not always solve delivered-clock drop by requesting a much higher clock. A curve that behaves well in one heavy benchmark may crash in a lighter game that actually tries to boost closer to the higher requested frequency. If the delivered clock is lower than expected, check whether you are power-limited, temperature-limited, voltage/current-limited, or simply asking for too much frequency at too little voltage.

If you want to compensate for clock drop, do it in small steps and test multiple workloads. You can slightly raise the requested frequency, slightly raise voltage, or lower your target clock. The correct answer depends on your GPU and your workload.

Validating in Real Workloads

Here is how a target of around 2860 MHz at 1000 mV looks in CS2.

CS2, Superposition, MSI Kombustor, FurMark, and 3DMark Steel Nomad are different workloads. They can all request different amounts of power from the GPU, and the delivered clock can change from one workload to another.

In this example, we request around 2860 MHz at 1000 mV, but in CS2 we get around 2820 MHz. That does not automatically mean the undervolt is bad, but it does tell us that this workload is not delivering the exact clock we expected.

CS2 test showing lower than requested GPU clock

Compensating for Clock Drop

Be cautious with this approach. If a heavier workload drops your delivered clock, that may mean the requested point is not truly stable at that voltage. Lighter workloads that boost closer to the requested clock can then crash. Raising the request can mask instability rather than fix it. Verify in both heavy and light workloads before keeping the higher request.

MSI Afterburner steeper VF curve requesting 2901 MHz at 1000 mV

In CS2, we now get around 2860 MHz at roughly 0.995 V. This is closer to what we expected.

CS2 showing around 2860 MHz at 0.995 V after curve adjustment

Running MSI Kombustor also matches our expectations in this test.

MSI Kombustor matching expected undervolt behavior
Important: This does not mean you should always raise the requested curve point aggressively. It means this specific card, in this specific test, behaved this way. Always test your final curve in multiple workloads.
TL;DR: You might try requesting 2880 to 2890 MHz at 1000 mV to reach around 2860 MHz during a specific load. This is not universal. Test it on your own card.

When the Score Consistently Drops, Stop Chasing Voltage

This is the point where we stop chasing lower voltage in that direction. The undervolt may be too aggressive, the requested frequency may be too high for that voltage, or the card may be hitting a different limit. The fix is usually to raise voltage slightly, lower the target frequency, or return to the previous stable curve.

Do not forget that each benchmark run has some score variation. We are not looking for tiny differences. We are looking for large score drops, crashes, artifacts, or behavior that clearly shows the GPU is no longer performing correctly.

Validating Your Undervolt

To validate your undervolt, open MSI Kombustor and copy the following settings.

MSI Kombustor stability test settings

Make sure to change the resolution if you are not using a 1080p monitor.

Then press RUN.

Let the stress test run for at least one hour as an early stability check. Passing one hour of Kombustor does not guarantee that the undervolt is stable in every game or application, but it is a useful first test.

Focus on the bottom-right area where you see ARTIFACTS.

The artifact count should stay at 0/0. If you see the artifact count increase, treat the profile as unstable. First confirm that the same test does not artifact at stock settings. If stock settings are clean and only your undervolt artifacts, raise voltage slightly, lower the target frequency, or return to the previous stable curve.

MSI Kombustor artifact counter during stability testing
Stock-control test: If you see artifacts, run the same test at stock settings. If stock settings also artifact, the issue may be driver, hardware, temperature, software, or the test itself rather than your undervolt.

Why We Use Kombustor Instead of Only FurMark

Some people may ask why we do not rely only on FurMark for testing.

FurMark and Kombustor are different applications, but they share some similarities. FurMark can be a much heavier power and thermal stress test depending on settings, driver behavior, cooling, and power limits. It can push the GPU into power, current, or thermal limits very quickly.

That does not mean FurMark ignores your VF curve. The curve is still there. However, because FurMark can create an extremely heavy load, the GPU may hit another limit first and boost down to a lower operating point than the one you expected from your curve.

Kombustor is useful because it lets us check the undervolt for artifacts and stability without relying only on the heaviest possible stress workload. However, Kombustor is still not enough by itself. You should also test the games and applications you actually use.

Overclocking the GPU

Overclocking the GPU is a bit easier to understand than undervolting, but it still needs careful testing. For a normal overclock, we usually increase the core clock and memory clock offsets, then validate that performance actually improves.

Important: Higher numbers are not always better. A GPU overclock can crash, artifact, reduce scores, increase power draw, increase heat, or become unstable in only some games. Always test and compare results.

Open MSI Afterburner and click the reset button so you are starting from a clean profile.

MSI Afterburner reset button before overclocking

For overclock testing, you can raise the Power Limit and Temperature Limit to the maximum your card allows. Raising the Core Voltage limit is optional and can allow higher boost voltage under load, which may increase heat and power draw. Do not treat it as required for every overclock.

Set the fan speed to the same fixed testing speed you used earlier, then start with a small core clock offset.

Recommended starting points:

GPU Type Conservative Core Start Step Size Near Limit
Recent RTX 40/50 cards +150 MHz to +200 MHz +10 MHz to +25 MHz
Older GPUs +10 MHz to +25 MHz +10 MHz to +25 MHz

If your card is known to have a lot of headroom, you can move faster, but beginners should not jump straight to large offsets. Test after each step.

When you are done, press the checkbox and apply your setting. Now open Superposition and start the test.

On our sample card, a +100 MHz core offset gives around 16490 points while clocking around 2970 MHz at roughly 1.055 V.

Superposition score with plus 100 MHz core overclock

We will use this as a base and keep going further. This is an example from our card, not a universal beginner starting point.

Setting +150 MHz on the core scores around 16730 points with roughly 3030 MHz on the core and 1.055 V.

Superposition score with plus 150 MHz core overclock

Setting +300 MHz on the core scores around 16320 points with roughly 3165 MHz and 1.055 V. This is a regression.

Superposition score regression with plus 300 MHz core overclock

A lower score at a higher clock can mean the overclock is unstable, the GPU is hitting another limit, or the run is affected by throttling or errors. This is our sign to stop pushing the core clock in that direction and test smaller steps.

Going back to a +200 MHz core offset gives us 16635 points, around 300 more points than our regression run. This is a sign that the higher offset was not behaving correctly in this benchmark.

Superposition score after returning to plus 200 MHz core offset

We will stick to +200 MHz on the core for this test session and focus on memory offset and voltage later on.

Setting +400 MHz on the core crashes Superposition during the run.

Superposition crash with plus 400 MHz core overclock

We found the rough limit of our core clock for this test. For daily use, it is usually better to back off from the maximum value. In this example, we would test values below the crash point and below the score-regression point, then validate them properly.

Memory Clock Overclocking

Memory overclocking can improve performance, especially in memory-sensitive games and benchmarks. However, memory overclocks can be deceptive. A bad memory overclock may not crash immediately. It may artifact, reduce scores, stutter, or behave differently across games.

Important: Do not assume a higher memory offset is better. Track benchmark scores and real-game behavior. If performance stops improving or starts dropping, back off.

Recommended memory offset starting points:

GPU Type Conservative Memory Offset Start Step Size Near Limit
Recent RTX 40/50 cards +1000 MHz to +1500 MHz +100 MHz to +250 MHz
Older GPUs +50 MHz to +100 MHz +25 MHz to +100 MHz

Some RTX 40-series and RTX 50-series cards may eventually handle much higher memory offsets, including +1000 MHz or more, but that should be discovered through testing, not assumed from the start.

Here is how our sample RTX 5070 Ti looks with a +1000 MHz memory offset and +200 MHz core offset.

MSI Afterburner showing plus 1000 MHz memory offset and plus 200 MHz core offset

Press Apply and start Superposition.

A +200 MHz core offset and +1000 MHz memory offset gives us around 16620 points.

Superposition score with plus 200 MHz core offset and plus 1000 MHz memory offset

A +200 MHz core offset and +2000 MHz memory offset gives us around 16834 points in Superposition.

Superposition score with plus 200 MHz core offset and plus 2000 MHz memory offset

A +200 MHz core offset and +1000 MHz memory offset gives us around 7265 points in 3DMark Steel Nomad.

3DMark Steel Nomad score with plus 200 MHz core offset and plus 1000 MHz memory offset

A +200 MHz core offset and +2000 MHz memory offset gives us around 7365 points in 3DMark Steel Nomad.

3DMark Steel Nomad score with plus 200 MHz core offset and plus 2000 MHz memory offset

A +200 MHz core offset and +3000 MHz memory offset gives us around 7299 points in 3DMark Steel Nomad. This is a regression, so for this workload we will fall back to +2000 MHz instead.

3DMark Steel Nomad score regression with plus 3000 MHz memory offset

Combining Undervolting and Overclocking

Now we will combine what we learned in this article.

Only continue with this section after you have separately tested your undervolt, core overclock, and memory overclock. Otherwise, you will not know which setting caused a crash, artifact, or score regression.

On our sample card, the strongest settings that behaved well in our earlier Steel Nomad testing were around +200 MHz on the core and +2000 MHz memory offset. These are not universal recommendations. They are example values from one card.

Daily-use recommendation: Your daily profile should usually be slightly below your maximum benchmark-stable profile. Backing off 25 to 50 MHz on the core and 100 to 250 MHz on memory can improve long-term stability.

Start Superposition or 3DMark Steel Nomad and observe your clocks and voltages.

In this example, a +200 MHz core offset gives us around 3040 MHz at 1.055 V during Superposition.

For context, with the same settings in an empty Dust2 map in CS2, the GPU can clock around 3080 MHz while running around the map.

This further shows that GPU load affects clock speed. We will not worry about a 30 MHz difference. It is not important by itself.

We will now try to chase around 3160 MHz at 1.045 V, which is a 10 mV reduction from the observed 1.055 V behavior.

Open the VF Curve Editor and look at the bottom of the graph to find your voltage target.

We want around 1.045 V, or 1045 mV. Depending on the exact voltage nodes shown by your version of MSI Afterburner, select the closest available voltage point. In this example, we click the point just before 1050 mV.

When we click on it, the left side shows our target is around 3180 MHz.

Remember what we said earlier: the requested frequency and delivered frequency may not be exactly the same. Because this card may deliver slightly lower clocks under load, we aim for around 3180 MHz on the curve to maintain around 3160 MHz in heavier benchmarks.

MSI Afterburner VF curve targeting around 3180 MHz at 1045 mV

We highlight the points to the right by holding SHIFT and dragging after our selected voltage point. Then we click on a point inside the selection and drop the selected points down.

After that, we let go of the keys, hold SHIFT, and press ENTER twice. Then we exit the curve editor and press Apply.

If you have trouble doing this, scroll back to the earlier VF curve section and repeat the instructions slowly.

Flattening the right side of the VF curve for combined undervolt and overclock

Now run Superposition or 3DMark Steel Nomad to check for score regression.

Our initial 3DMark Steel Nomad score is around 7505 points, almost the same as before the undervolt.

3DMark Steel Nomad score after combined undervolt and overclock

In this specific run, the GPU cannot always reach 3160 MHz and 1.045 V during the full benchmark load, so it sometimes drops to around 3060 MHz during the run.

On the other hand, if we launch an MSI Kombustor stress test, we can see our target is very close.

MSI Kombustor showing combined undervolt and overclock target behavior

While running the Superposition benchmark, we can also see the target being reached during parts of the run.

This further shows the difference between benchmarking applications and workloads.

Superposition showing different clock behavior after combined undervolt and overclock

In a separate Superposition-focused run, we also tested around 3160 MHz on the core, +3000 MHz memory offset, and roughly 1.045 V. That scored around 17264 points.

Superposition score after combined undervolt and overclock at 1045 mV

We are not only looking for a higher score. We are looking for no steep regression in clocks or score, lower or controlled power draw, acceptable temperatures, and stable behavior.

We will now try chasing 1.035 V at the same target clock speed.

MSI Afterburner VF curve targeting lower voltage at same clock speed

Running 3DMark now scores fewer points because our target cannot be maintained consistently, so clock speed and voltage drop.

3DMark score regression after too aggressive combined undervolt and overclock

Superposition also shows regression, although not an extreme one.

It follows the same pattern as 3DMark. During the run, the card cannot sustain around 3160 MHz at 1.035 V, so it drops to around 3120 MHz and 1.030 V.

Superposition regression after trying 1035 mV at the same target clock

At this point, the better daily profile is probably the previous voltage target, a slightly lower target clock, or a small reduction in memory overclock. Do not chase the lowest possible voltage if it creates score regression, clock drops, crashes, or artifacts.

The Formula

The basic process is:

  1. Find a repeatable stock baseline.
  2. Find a stable core clock offset.
  3. Find a stable memory offset.
  4. Observe the voltage and clock behavior during your benchmark or game.
  5. Lower voltage in small steps, such as 10 mV at a time.
  6. Benchmark and stress test after each change.
  7. Stop lowering voltage when clocks drop, scores regress, artifacts appear, or crashes happen.

For example, if your core target is around 3000 MHz, your memory offset is +2000 MHz, and the card runs around 1.055 V, you can try around 1.045 V and benchmark again. If the score, clocks, temperatures, and stability still look good, continue carefully. If performance regresses or stability gets worse, return to the previous setting.

Validate Your Overclock

Validating your overclock is important. A benchmark pass does not prove the overclock is stable. It only proves that the card survived that specific run.

We will use two tools:

  • MSI Kombustor
  • OCCT

Start by running MSI Kombustor for at least one hour.

MSI Kombustor running for overclock validation

While running Kombustor, focus on the bottom-right artifact area.

The artifact field should remain 0/0 at all times. If you see the number increase, lower your clocks and validate again. Also test stock settings to confirm the artifact is caused by your overclock and not another issue.

MSI Kombustor artifact counter during overclock validation

If you pass Kombustor, run OCCT as an additional stability test.

During real gameplay, GPU load changes rapidly. These load transitions can create fast power/current changes and quick boost-state changes that a flat 100% stress test may not expose. OCCT 3D Adaptive Switch mode can help expose instability from changing GPU load, but it is still not a perfect replacement for testing your actual games and applications.

Open OCCT and go to the settings tab.

OCCT settings tab

Enable the following options if they are available:

  • Stop on error
  • Stop on WHEA error

Navigate to Stability Test, select 3D Adaptive, and choose Switch.

Use the following starting settings:

  • First intensity: 30%
  • Second intensity: 100%
  • Interval: 500 ms

You can change the settings later if needed, but these are a good starting point.

Press Start and wait a few seconds for the test to initiate.

OCCT 3D Adaptive Switch stability test settings

Looking at MSI Afterburner, you will see OCCT's adaptive load behavior changing GPU load, voltage, and clock speed.

MSI Afterburner showing GPU clock and voltage changes during OCCT adaptive test

We suggest one hour of OCCT as a minimum early validation test.

Since VRAM tuning was also a part of the process, we suggest running a 98% stress on your GPU with OCCT's VRAM suite.

OCCT VRAM stress test settings

You can also run a combined test with the following preset to add some more pressure to the card.

You can set the first intensity percentage based around your game's average GPU usage. For us, we will use 60%.

OCCT combined GPU test settings

How to Save a Profile in MSI Afterburner

  1. Click on the lock.
  2. Click on the save button.
  3. Click on the Windows button if you want to autoload the profile on boot.
  4. Click on profile slot 1.
Saving a profile in MSI Afterburner
Important: Passing Kombustor and OCCT is not final proof of stability. After synthetic testing, test your actual games and applications. Include at least one heavy GPU workload, one lighter high-FPS game, and any ray tracing or VRAM-heavy workloads you actually use.

Unstable GPU clocks can cause crashes, driver resets, artifacts, flickering, stuttering, hitching, or lower benchmark scores. However, stuttering can also come from CPU, RAM, storage, shader compilation, game engine behavior, or background software, so do not blame every stutter on the GPU overclock.

Ray-traced workloads stress different parts of the GPU than raster benchmarks. A profile that passes Superposition, Kombustor, and OCCT can still crash in path-traced games or AI workloads. If you use these, include at least one as part of your validation.

For CPU-side overclocking and stress testing, read our AM5 Infinity Fabric – FCLK overclocking and stability testing article.

9800x3d

AM5 Infinity Fabric – FCLK overclocking and stability testing.

AM5 FCLK Overclocking Guide: Tuning, Stress Testing, and Stability Validation

In this AM5 FCLK overclocking guide, we will cover how to tune Fabric Clock, stress-test it with Linpack and y-cruncher, and validate stability on an AM5 Ryzen system.

FCLK Overclocking Basics for AM5

FCLK, or Fabric Clock, is the clock frequency of AMD’s Infinity Fabric interconnect.

On AM5 DDR5 systems, FCLK is usually tuned independently.

FCLK frequency depends on both silicon quality and BIOS/AGESA version. During the early Ryzen 7 9850X3D release window, our chip would instantly crash at 2100 MHz FCLK. With later BIOS/AGESA versions, 2200 MHz became stable on the same chip.

An unstable Curve Optimizer configuration or excessive boost-clock offset can mimic FCLK instability — creating high variation during Linpack and even number variation during y-cruncher VT3.

Before tuning FCLK, make sure your system is running from a known-stable baseline. Your RAM timings, PBO, boost-offset, and Curve Optimizer settings should already be stable. If they aren’t, fix them first, otherwise, Linpack or y-cruncher variation can be caused by something other than FCLK.

Important: Disable your iGPU before proceeding.

FCLK overclocking BIOS iGPU setting on AM5

Reminder: If your PBO settings or RAM timings are not fully stable, your FCLK tuning results will not be reliable.

If your motherboard allows it, set CPU and VDDCR_SOC/VSOC power and duty control to Extreme for additional stability under load. A higher load-line calibration setting may also help, but this should be determined during your PBO tuning phase.

FCLK overclocking BIOS power and duty control settings

Voltage Terminology

Before tuning, it’s important to understand the voltage rails involved. BIOS names vary by motherboard vendor, but the terms below match the common AM5/Ryzen terminology used for memory and fabric tuning.

VDDCR_SOC / VSOC

Powers SoC logic, including the DDR5 memory controller and other IOD/SoC IP blocks. Important for RAM and UCLK stability. Do not treat VSOC as the dedicated fabric voltage.

CLDO VDDP / VDDP

The DDR5 bus-signaling / DRAM PHY supply. Affects memory training, boot behavior, and RAM stability.

CLDO VDDG IOD & CCD

Fabric/data-path signaling voltages for the IOD↔CCD Infinity Fabric/GMI links. The primary tools for stabilizing higher FCLK frequencies. These are separate rails and may prefer different values depending on the CPU.

VDDCR_MISC / VDD Misc

A supply rail and the source rail for the internally regulated VDDG fabric voltages. Changing VDD Misc does not automatically change CLDO VDDG CCD/IOD — set and verify VDDG separately.

For FCLK overclocking specifically, the key rails are usually CLDO VDDG IOD and CLDO VDDG CCD, while VSOC should be treated mainly as the voltage needed for your RAM and UCLK target.

FCLK Overclocking and VSOC Behavior

High FCLK can be sensitive to VSOC, but higher VSOC does not universally improve FCLK headroom.

Treat VSOC primarily as the voltage needed for your RAM and UCLK target, and use the lowest stable value — excessive VSOC can hurt FCLK stability. For fabric-specific tuning, focus on CLDO VDDG CCD/IOD.

VSOC requirements are silicon-dependent. On our Ryzen 7 9850X3D, we needed 1.25 V VSOC to run UCLK 3200 MHz.

Before continuing: Find the baseline VSOC voltage that works with your RAM and UCLK target first.

BCLK and Spread Spectrum

Head into the BIOS and find BCLK or CPU Clock Control, then set it to 100.000 MHz. This is a picture from a Gigabyte board:

Gigabyte BIOS CPU Clock Control set to 100 MHz

And here’s the same setting on an ASUS board:

ASUS BIOS CPU Clock Control set to 100 MHz

Then look for Spread Spectrum and disable it.

BIOS Spread Spectrum option set to disabled

Starting Voltages for FCLK Overclocking

Set VSOC according to your own silicon and memory-controller requirements. Around 1.20 V is a reasonable starting target for many AM5 CPUs, but our sample uses 1.25 V.

Suggested starting values:

  • VSOC: Your known-good RAM/UCLK value
  • VDDP: 1.00 V
  • VDD Misc: 1.10 V
  • VDDG CCD: 0.95 V
  • VDDG IOD: 0.95 V
FCLK overclocking BIOS voltage settings for VDDG and VSOC

The key voltages here are VDDG CCD and VDDG IOD.

On some boards and AGESA versions, Auto rules may make Ryzen Master or HWiNFO report CLDO VDDG CCD/IOD around 1.050 V (1050 mV). Treat this as board/BIOS-dependent behavior, not a universal AMD default.

Some chips may prefer lower IOD voltage. In our FPSHEAVEN consultations, several Ryzen 7 9800X3D systems showed lower Linpack deviation at 970 mV than at 1050 mV, while both settings still passed within accepted deviation. If your system can run lower voltages while remaining stable, that is ideal.

FCLK Overclocking Target

Your goal is to reach 2100 MHz FCLK or higher. 2100 MHz as the first meaningful manual test point.

Recommendation: If you can’t stabilize 2100 MHz after proper testing, do not settle for 2033 MHz or 2067 MHz. Return to 2000 MHz, stop FCLK tuning, and move on to PBO and memory-timing optimization.

For this workflow, use the same test settings after every BIOS change so the results remain comparable.

Required Tools

Download the following tools and place them in a single folder on your desktop.

Required dependency: Install the latest Visual C++ Redistributable Runtime package before running y-cruncher.

Initial BIOS Setup

Enter the BIOS, set FCLK to 2100 MHz, save, exit, and boot into Windows.

Linpack and y-cruncher results can be affected by Windows background processes and other applications, so we’ll run our testing in Safe Mode.

Booting Into Safe Mode

  1. Open msconfig.
Opening msconfig in Windows for FCLK overclocking Safe Mode testing
  1. Go to the Boot tab.
  2. Select Safe boot.
  3. Click Apply, then OK.
Safe boot option in msconfig

Your PC will now restart into Safe Mode.

Important: When testing is finished, return to msconfig and uncheck Safe boot. Otherwise, Windows will keep booting into Safe Mode.

Linpack Xtreme Configuration

Once you’re in Safe Mode, open Linpack Xtreme and configure it as shown below.

Step 1 — Enter 2:

Linpack Xtreme configuration step 1

Step 2 — Enter 5:

Linpack Xtreme configuration step 2

Step 3 — Enter 40:

Linpack Xtreme loop configuration

Step 4 — Answer the remaining prompts:

  • Y
  • Y
  • N
  • N — press N when you see the warning
Linpack Xtreme warning prompt

Linpack is now configured to run 40 loops using 10 GB of RAM. You can select 30 loops if you wish to wait less time.

Reading Linpack Results

Each Linpack result has one important value: GFLOPs.

The image below shows a 40-loop, 10 GB result from our Ryzen 7 9850X3D using 950 mV for both VDDG CCD and VDDG IOD.

Stable Linpack Xtreme result during FCLK overclocking

During FCLK overclocking, Linpack consistency is useful because large GFLOPs swings expose instability quickly. Focus on the difference between the GFLOPs values from each run.

Our standard is strict: we allow a maximum difference of roughly 1.0 to 1.2 GFLOPs at best. Some users may accept variation around 2 GFLOPs, but we prefer tighter consistency.

At the bottom of the result you’ll also see the average and maximum values. These should be as close together as possible but the most important thing is the per-run variation.

This an image from our customer using a 7800X3D. The consistency of the results are excellent.

Example of Unstable Behavior

The altered image below shows what unstable or FCLK-related behavior may look like during Linpack testing.

Example of unstable Linpack result during FCLK overclocking

In this example, some runs show values such as 363, 377, and 375 GFLOPs while others are around 482 GFLOPs. This result is not stable.

At this point, go back into the BIOS and raise VDDG IOD from 950 mV to 1000 mV. We recommend starting with a 50 mV bump to save time during initial testing — once stability is found, you can lower the voltage in 10 mV steps to find the minimum stable value.

Guide limit: In this tuning procedure, keep CLDO VDDG CCD/IOD at or below 1050 mV.

FCLK Tuning Loop

After changing voltage, return to Safe Mode and run the same Linpack test again. When the test is complete, check the GFLOPs variation:

  • Is the variation above 2 GFLOPs?
  • Is the spread larger than your acceptable limit?
  • Are some runs clearly much lower than the rest?

If the variation is still too high, continue tuning:

  1. Raise VDDG IOD until you reach 1050 mV.
  2. If variation is still too high, begin raising VDDG CCD by 10–20 mV.
  3. Retest after every change.
  4. Do not exceed 1050 mV on either VDDG CCD or VDDG IOD.

If you still can’t achieve consistent Linpack results, set FCLK back to 2000 MHz, stop FCLK tuning, and continue with PBO and memory timing optimization.

Further Validation

After Linpack testing, ou can further validate your AM5 FCLK overclocking stability with y-cruncher and FurMark. We’ll start with y-cruncher and observe the variance between each run.

y-cruncher VT3 Setup in Safe Mode

  1. Open the folder you created on your desktop.
  2. Right-click y-cruncher and create a shortcut.
  3. Right-click the shortcut and open Properties.
  4. Find the Target field.
y-cruncher shortcut properties

At the end of the Target field, append the following command:

stress -TL:3600 VST VT3 -M:28g

The final target should look similar to this:

"C:\Path\To\y-cruncher.exe" stress -TL:3600 VST VT3 -M:28g

This starts y-cruncher for 3600 seconds (one hour) using the VT3 test and 28 GB of RAM. You can adjust the memory amount if needed. Double-click the shortcut to start y-cruncher.

y-cruncher VT3 running during FCLK overclocking validation

The image above shows our Ryzen 7 9850X3D running VT3.

Reading y-cruncher VT3 Results

During VT3, focus on the first speed value shown in each result line.

y-cruncher VT3 speed variation

We consider a variation of roughly 0.03 to 0.06 acceptable. In our example, the test started around 1.04 and later stabilized around 1.07 — a difference of about 0.03, which is very acceptable.

In Safe Mode, we don’t focus too heavily on y-cruncher speed variation. The main goal is to check whether the test crashes, shows abnormal number variation, or produces WHEA hardware-error events.

A crash may look like this:

Example of y-cruncher crash

You can stress-test with y-cruncher for longer if needed, but one hour is enough for an early stability check. We suggest a minimum of 70 iterations.

Final Confirmation: y-cruncher + FurMark

After passing the Safe Mode checks, leave Safe Mode and boot back into normal Windows. This final AM5 FCLK overclocking test combines CPU, memory fabric, and GPU load to expose instability that may not appear during isolated testing.

  1. Boot back into normal Windows.
  2. Download and install HWiNFO.
  3. Open HWiNFO and press Start.
  4. Open FurMark and copy the settings shown below.

We use a 1080p monitor, so we keep the FurMark resolution set to 1080p. Start the FurMark test, then minimize it.

FurMark stress test settings

Now find your y-cruncher shortcut and run it again. Arrange HWiNFO, FurMark, and y-cruncher on screen so you can monitor all three at the same time.

In HWiNFO, scroll all the way down and look for WHEA Errors. Monitor the WHEA hardware-error counters during the test.

HWiNFO WHEA error monitoring during FCLK overclocking validation

The final FCLK overclocking check should include normal Windows testing, GPU load, and WHEA monitoring. The duration is up to you — FCLK instability often shows up quickly, so even one hour of stress testing can provide useful clues.

Important: Passing every synthetic test does not guarantee perfect real-world stability. FCLK can still be unstable during gameplay.

Use this guide as a repeatable validation process — not a guarantee that every AM5 CPU will reach the same frequency.

Alternative: OCCT Instead of FurMark

You can also use OCCT instead of Furmark to put load into your GPU and FCLK.

  1. Download OCCT from here and open the application.
  2. Go to settings and then enable Stop on error and Stop on WHEA error.
OCCT settings with Stop on error and Stop on WHEA error enabled
  1. Click on Stability Test and select Combined with 3D Adaptive and VRAM.
  2. Copy the settings below and start the test.
OCCT Combined stability test settings

Wait 10 seconds and then as soon as the test starts, launch y-cruncher.

TL;DR

The short version of this AM5 FCLK overclocking guide:

  1. Make sure your PBO and RAM tune are rock stable. If unsure, revert to defaults and tune them later.
  2. Disable the iGPU.
  3. Set VDDP to 1.00 V, MISC to 1.1 V and VDDG CCD & IOD to 950 mV.
  4. Boot into Safe Mode and observe Linpack variation. We aim for 1.0–1.5 GFLOPs max.
  5. If unstable or variation is too high, raise VDDG IOD by 10 mV and retest. If you hit 1050 mV and it’s still unstable, start raising VDDG CCD.
  6. Stable in Linpack? Run y-cruncher VT3 for further validation — or, if you’re lazy, boot back into Windows and run y-cruncher + FurMark (or OCCT GPU+VRAM) while watching WHEA errors in HWiNFO.
  7. Rinse and repeat until you’ve found your stable FCLK ceiling.
Receive Side Scaling NDIS DPC CPU placement

Receive Side Scaling and Offloading: Observing ISR/DPC Placement in Windows

Receive Side Scaling and Offloading: Observing ISR/DPC Placement in Windows

An article work in progress.

Networking is one of the most important, yet often overlooked, aspects of performance.

In this article, we will look at a few combinations of Windows networking settings and observe how they affect interrupt delivery, miniport ISR/DPC execution, RSS behavior, TCP/IP task offload state, and logical processor placement.

The results shown below are based on our own testing on one setup. They should be treated as setup-specific observations, not as universal behavior for every NIC, driver, firmware version, Windows build, RSS profile, MSI-X configuration, or workload.


Terminology

Before looking at the experiments, here is a quick explanation of the main terms used throughout the article.

Interrupt

When a device, such as a network card, receives a packet, it needs to notify the processor. This hardware signal that acts like a notification is called an interrupt.

In simple terms, the CPU gets poked because the network card has something to say.

ISR

An Interrupt Service Routine (ISR) is the first driver-provided code that runs in response to an interrupt. It handles the time-critical work quickly, then typically schedules a Deferred Procedure Call (DPC) to perform the heavier processing later.

DPC

A Deferred Procedure Call, or DPC, is a deferred execution path used to continue work that was triggered by an interrupt. In the classic NDIS miniport interrupt model, NDIS calls the miniport driver’s MiniportInterruptDPCcallback to complete deferred interrupt processing. You can think DPCs as some workers who do the real heavy lifting (if that makes sense)

Receive Side Scaling

Receive Side Scaling, also known as RSS, is a network-driver technology that distributes receive-side network processing across multiple processors. RSS uses a hash of incoming packet headers and an indirection table to associate received traffic with a processor, helping keep traffic for a given connection on a consistent processor while spreading receive work across the system.

Important: interrupt affinity and RSS processor selection are related but not identical. Interrupt affinity controls where the device interrupt may be delivered. RSS receive-processing placement can also depend on the RSS processor array, receive queues, hash result, indirection table, RSS profile, NUMA settings, MSI/MSI-X support, and NIC/driver behavior.

Offloading

TCP/IP task offload allows the Microsoft TCP/IP transport to offload supported packet-processing tasks to a capable network adapter. This can reduce CPU-side per-packet work, but the exact behavior depends on the NIC, driver, firmware, Windows version, workload, and adapter configuration.

Examples include checksum offload, Large Send Offload v1/v2 (LSOv1/LSOv2), Receive Segment Coalescing (RSC), NVGRE task offload, and UDP Segmentation Offload (USO), depending on OS and device support.

  • With task offloading disabled by DisableTaskOffload = 1, meaning TCP/IP task offloads are globally disabled.
  • With task offloading enabled by DisableTaskOffload = 0, meaning TCP/IP task offloads are enabled/allowed, assuming NIC and driver support

This setting should not be interpreted as a simple universal switch where every packet calculation always moves between the CPU and NIC in the same way on every system.


Experiments

Experiment 1: Interrupt affinity pinned to logical processor 14 with RSS enabled

Configuration:

  • Interrupt affinity pinned to CPU 14
  • RSS enabled
  • 2 RSS queues

Observation:

NDIS DPCs were observed on logical processor 12 and logical processor 14..

NDIS DPCs on CPU 12 and CPU 14

The miniport ISR path was observed on logical processor 14.


NDIS DPC execution times on logical processor 12 and logical processor 14.

Interpretation:

With RSS enabled, receive-side DPC placement does not necessarily have to match only the manually selected interrupt-affinity processor. RSS can distribute receive processing across multiple processors. A logical processor that is outside the manual interrupt-affinity mask may still be part of the RSS processor array, receive queue mapping, or RSS indirection table.

For this reason, seeing DPC activity on logical processor 12 while the miniport ISR path was observed on logical processor 14 should be treated as a receive-processing placement observation, not automatically as a broken state. To prove that the placement is unexpected, the RSS processor array, indirection table, receive queue mapping, MSI/MSI-X mapping, NIC model, driver version, Windows build, and ETW/WPA call stacks should also be checked.


Experiment 2: Interrupt affinity pinned to logical processor 14 with RSS disabled

Configuration:

  • Interrupt affinity pinned to logical processor 14
  • RSS disabled

Observation:

NDIS ISRs were executed on logical processor 14.

NDIS ISRs on CPU 14 with RSS disabled

DPC activity was also observed on logical processor 14.

NDIS DPCs on CPU 14 with RSS disabled

With RSS disabled in this test, both ISR and DPC activity stayed on the pinned CPU.


Experiment 3: Interrupt affinity pinned to logical processor 14 with RSS disabled and task offload disabled (DisableTaskOffload 1)

Configuration:

  • Interrupt affinity pinned to CPU 14
  • RSS disabled
  • DisableTaskOffload = 1

Observation:

NDIS ISR routines were executed on CPU 14.

NDIS ISR routines on CPU 14

ISR execution time:

ISR execution time

DPC execution time:

251,229 DPC samples attributed to NDIS.SYS lasted between 4 – 8 microseconds. That is about 60% of the NDIS.SYS DPC samples.

DPC execution happens on CPU 14.

Interpretation:

This part of the test was used to observe behavior with RSS disabled while global task offload was disabled. Since RSS was disabled, the receive-side work did not use RSS-based spreading in this configuration.


Experiment 4: DisableTaskOffload 1 correlated with changed observed RSS/DPC placement.

Configuration:

  • NIC interrupts pinned to CPU 14 and CPU 16
  • RSS enabled
  • 2 RSS queues
  • DisableTaskOffload = 1

Observation:

Interrupts were routed to the selected CPUs.

Interrupts routed to selected CPUs

However, NDIS DPC execution was observed on CPU 12, even though CPU 12 was not part of the manually selected NIC interrupt-affinity mask.

DPC executions on CPU 12

Interpretation:

In this test, enabling DisableTaskOffload appeared to change the observed DPC placement while RSS was enabled. Interrupts were routed to the selected CPUs, but NDIS DPC execution was observed on CPU 12.

This does not automatically prove that Windows or RSS was broken. Interrupt affinity and RSS receive-processing placement are not the same mechanism. CPU 12 may still have been part of the RSS processor array, RSS indirection table, receive queue mapping, or another driver-specific receive path. To call this definitively unexpected, those RSS and MSI-X details should be verified before and after changing DisableTaskOffload.


Reminder: restart the adapter or reboot after changing task-offload state

After changing global task-offload settings, restart the network adapter or reboot the system before testing. A full reboot is the safest option when using the registry directly, because it helps avoid stale driver, NDIS, or adapter state.

Experiment 5: DisableTaskOffload set back to 0

Configuration:

  • NIC interrupt affinity configured manually
  • RSS enabled
  • DisableTaskOffload = 0

Observation:

DPCs were observed on the CPUs selected for this test, rather than being observed on CPU 12.

DPCs executed on configured affinity

The same placement was also observed with ISR routines.

ISR routines on configured affinity

After setting DisableTaskOffload = 0 and restarting/reinitializing the networking stack, the observed ISR/DPC placement matched our intended CPU placement again in this test.


What does DisableTaskOffload do?

When set to 1, Windows disables task offloads from the TCP/IP transport. When set to 0, Windows enables task offloads from the TCP/IP transport, assuming the NIC, driver, firmware, and adapter settings support them.

Task offload can include work such as checksum offload, Large Send Offload v1/v2, Receive Segment Coalescing, NVGRE task offload, and UDP Segmentation Offload, depending on OS and device support. Moving work back to the CPU can increase CPU cycles and CPU load, but the real-world impact depends on the NIC, driver, firmware, workload, packet rate, traffic direction, adapter settings, and available CPU headroom.

Microsoft’s Windows Server network-adapter tuning guidance generally recommends enabling useful static offloads such as UDP checksums, TCP checksums, and LSO for microsecond-sensitive packet-processing scenarios. That guidance is useful, but it should not be treated as a universal rule for every client/gaming system, NIC, driver, firmware version, or workload.

In our 2024 CS2 testing, we observed that a specific frametime spike and small hitch before an enemy peek disappeared after changing this setting. This is anecdotal and setup-specific. It should not be treated as proof that DisableTaskOffload = 1 improves CS2 performance generally.

It is a useful clue, not a universal conclusion.

Experiment 5: Does DisableTaskOffload 1 break RSS?

Experiment 5: Does DisableTaskOffload  1 break RSS?

On this setup, after setting DisableTaskOffload to 1, Get-NetAdapterRss still reported RSS as enabled, with two receive queues and an RSS processor array containing logical processors 12 and 14. However, the IndirectionTable field was blank/not displayed in this output.

This should not be phrased as proof that DisableTaskOffload = 1 universally breaks RSS or prevents Windows from maintaining or using an RSS indirection table. Microsoft documents `DisableTaskOffload` as a TCP/IP task-offload switch, while RSS has its own configuration, processor selection, receive queues, and indirection table.

The narrower conclusion is that, in this test state, the RSS indirection table was not observable from the Get-NetAdapterRss output. Because logical processor 12 appears in the RSS processor array, DPC activity on logical processor 12 is not automatically unexpected from an RSS-placement perspective. To determine whether RSS behavior changed, collect Get-NetAdapterRss, RSS indirection-table output if available, receive queue mapping, MSI/MSI-X mapping, and ETW/WPA traces before and after changing DisableTaskOffload.

a

RSSv2 note: on newer Windows/NDIS versions and drivers that support RSSv2, receive queue and indirection-table behavior can be more dynamic. Microsoft documents RSSv2 for NDIS 6.80 and later, including dynamic queue spreading and indirection table entry (ITE) movement. This means that observed receive-side processor placement can depend on whether the adapter/driver is using RSSv1-style behavior, RSSv2 behavior, VMQ/vRSS-related behavior, or another driver-specific path.

Read more here


Further reading


Summary

Based on our testing:

  • With RSS disabled, ISR and DPC activity stayed on the manually selected interrupt CPU.
  • With RSS enabled, receive-side DPC placement was not determined only by the manual interrupt-affinity mask.
  • With DisableTaskOffload = 1, NDIS DPC execution was observed on CPU 12, even though NIC interrupts were configured for CPU 14 and CPU 16.
  • With DisableTaskOffload = 0, observed ISR/DPC placement matched our intended CPU placement again in this test.

In this setup, DisableTaskOffload = 1 changed the observed RSS/DPC placement behavior. This does not prove that DisableTaskOffload = 1 universally breaks RSS or DPC placement.

The safer conclusion is that the global task-offload state appeared to affect receive-side DPC placement on this specific NIC/driver/Windows configuration. To make the result stronger, the RSS indirection table, receive queues, MSI-X mapping, NIC model, driver version, Windows build, and ETW/WPA trace data should be documented as well.

This article will be updated with further documentation later on.

Related: You may also want to read our guide on Windows performance tuning.

CS2 FPS optimization guide Windows NVIDIA settings

CS2 FPS Optimization Guide: Windows, NVIDIA & Best Settings

This CS2 FPS optimization guide shows you how to optimize Windows, clean-install NVIDIA drivers, configure FPS caps, tune launch options, and choose the best CS2 settings for smoother gameplay. This is a very simple guide that anyone can follow.

The goal is simple: improve CS2 performance, reduce stutter, clean up unnecessary background load, and build a stable setup for competitive Counter-Strike 2.

Before You Start

Before we jump in, it is important that you create a system restore point. Do not worry, nothing we are doing today is irreversible.

Creating a Restore Point

Create a restore point

  1. Search for "restore point" in your Windows search bar.
  2. Click Create a restore point.
  3. Select your C drive, then click Configure in the bottom right.
  4. Select Turn on system protection, slide the bar to 10 GB, then click Apply and OK.
  5. Click Create, set a name for the restore point in the box, then click Create.
  6. Click OK, then restart your PC.

Windows Updates

Windows Update

  1. Search for "Check for Updates" in Windows Search.
  2. Updates may take a few minutes, so please be patient while the installation processes.
  3. Once the updates are downloaded and installed, restart your PC.

FACEIT might still complain about missing updates. This is your sign to update to Windows 11 25H2. Here is how to do it.

Open CMD as administrator, then copy and paste the following text.

REG ADD "HKLM\SOFTWARE\Policies\Microsoft\Windows\WindowsUpdate" /f && REG ADD "HKLM\SOFTWARE\Policies\Microsoft\Windows\WindowsUpdate" /v TargetReleaseVersion /t REG_DWORD /d 1 /f && REG ADD "HKLM\SOFTWARE\Policies\Microsoft\Windows\WindowsUpdate" /v TargetReleaseVersionInfo /t REG_SZ /d 25H2 /f

You will see something like this.

Windows 11 update command for CS2 optimization

Then, scan for updates again and wait for 25H2 to be installed.

Clean Up Your PC

  1. Download and install Malwarebytes, a free and very popular anti-malware solution.
  2. Click the Scan button after the installation is complete.

Malwarebytes scan before CS2 FPS optimization

  1. The scan can take up to 30 minutes, depending on the speed of your PC and the number of files that need to be scanned.

Malwarebytes scan progress before CS2 FPS optimization

  1. Once complete, you will either see that there are no threats and you can move on, or you will see Threat Scan results.
  2. Click Quarantine if you have items in your Threat Scan results.
  3. Restart your PC.

Custom Windows Power Plan

  1. Create a folder on your C:\ drive and name it FPSHEAVEN_TUTORIAL.
  2. Download the FPSHEAVEN2026 power plan and unzip the files into the newly created folder. The link will automatically start the download.
  3. When you extract the ZIP to the FPSHEAVEN_TUTORIAL folder, it should look like this:

Extracted FPSHEAVEN power plan files for CS2 FPS boost

  1. Open Command Prompt and enter the following command: powercfg -import "C:\FPSHEAVEN_TUTORIAL\FPSHEAVEN2026.pow".
  2. Enter powercfg.cpl.
  3. In the newly opened window, select the FPSHEAVEN2026 power plan.
  4. Reboot your PC.

Windows power plan for CS2 FPS boost

Windows Cleanup

Next, we are going to clean up your Windows install by removing temporary files and running Disk Cleanup.

Delete Temp Files

Windows Temp folder cleanup for better CS2 performance

  1. Press Windows key + R on your keyboard to open Run.
  2. Enter C:\Windows\Temp and click OK.
  3. Select all the files in the folder by selecting a random file and pressing CTRL+A on your keyboard.
  4. Press your Delete key.
  5. Tick the Do this for all current items box and click Skip.
  6. Repeat the process for the AppData Temp folder by entering %temp% into Run.

Some items may not delete. This is fine, and you can proceed to the next step.

Disk Cleanup

Disk cleanup

  1. Press Windows key + R on your keyboard to open Run.
  2. Paste C:\Windows\System32\cleanmgr.exe and click OK.
  3. Select the C:\ drive and click OK.
  4. Tick every box, click OK, then click Delete Files.

Cleaning System Files

  1. Press Windows key + R on your keyboard to open Run.
  2. Paste C:\Windows\System32\cleanmgr.exe and click OK.
  3. Click Clean up system files.
  4. Choose what you want to clean. Most people select everything.
  5. Click OK. This process might take a bit longer, so be patient.

Disable Startup Apps

Disabling unnecessary startup apps can reduce background load and make CS2 run smoother.

Task Manager startup apps for smoother CS2 gameplay

  1. Press CTRL+SHIFT+ESC to open Task Manager.
  2. Select the Startup tab.
  3. Right-click the programs you do not want running on startup, then click Disable.

Remove Unused Apps

To remove apps, we will use Geek Uninstaller. You can download Geek Uninstaller from the official website. This will download a ZIP file. Extract it and move geek.exe to our folder again. Run the app and start double-clicking apps you do not need.

For example, I want to remove REAL VNC.

Geek Uninstaller app removal before CS2 optimization

I will double-click it, follow the uninstallation process, and then clean the remaining entries.

Geek Uninstaller remaining entries cleanup

You can also remove Microsoft apps by clicking View and then Show Microsoft Store Apps.

Geek Uninstaller Microsoft Store apps menu

The removal logic is the same: find the app you do not want to keep and double-click it.

Geek Uninstaller Microsoft Store app list

GPU Driver Removal with DDU

A clean GPU driver setup is one of the most important parts of this CS2 FPS optimization guide. We will remove the old driver first, then install a clean driver package.

  1. Download DDU (Display Driver Uninstaller).
  2. Open the ZIP and run the EXE. Then, you will see this:

DDU extraction for clean GPU driver removal

  1. Paste the following text inside the bar and press EXTRACT.

DDU extract path for CS2 optimization

  1. Go to the FPSHEAVEN_TUTORIAL folder, find Display Driver Uninstaller, and run it.
  2. In the settings menu, make sure to check the settings highlighted in the image.

DDU settings for clean GPU driver removal

Display Driver Uninstaller for CS2 FPS optimization

Clean GPU Driver Install

Next, we are going to install new GPU drivers using a utility called NVCleanInstall. If you have an AMD or Intel GPU, simply install the latest Radeon drivers or Intel Arc drivers respectively, and skip this step along with the Profile Inspector step.

  1. Download and install NVCleanInstall, which lets you customize and install the NVIDIA driver package.
  2. Open the program and select Manually select a driver version.
  3. Select the latest driver and make sure it says 64-bit Desktop.
  4. If you are on a laptop, select 64-bit Notebook.
  5. Click Next, do not tick any options, and then click Next again.
  6. Copy the settings you see below on the Installation Tweaks screen, then click Next.

NVCleanInstall settings for CS2 FPS optimization

NVCleanInstall installation tweaks for CS2 performance

Click Next, then Install, and wait for the installation to complete. When the installation is complete, you will see an error. Ignore it and reboot your PC.

CS2 NVIDIA Settings with NVIDIA Profile Inspector

These CS2 NVIDIA settings are applied through NVIDIA Profile Inspector. The goal is to import a CS2-specific profile and avoid changing the NVIDIA 3D section afterward.

  1. Download NVIDIA Profile Inspector by orbmu2k and our CS2.nip file. Both files will auto-download.
  2. Extract both ZIP files to the FPSHEAVEN_TUTORIAL folder, open nvidiaProfileInspector, and click the button pointing at Import Profile(s).

CS2 NVIDIA settings import with NVIDIA Profile Inspector

  1. Find and select CS2.NIP, which is located in the FPSHEAVEN_TUTORIAL folder.

CS2 NVIDIA Profile Inspector profile file

  1. You will see a Profiles successfully imported pop-up.
  2. Then click Apply Changes in the top right.

CS2 NVIDIA settings applied in Profile Inspector

  1. This profile has settings specific to CS2.
  2. DO NOT change anything in the 3D section of NVIDIA. This will revert what we just did.

FPS Cap

Important: Before you proceed here, please read the following paragraph carefully.

When we force a driver-level or RTSS-level framerate cap, we need to think about our goal. If our goal is to have the lowest latency possible, then we must not cap our framerate. It comes down to two options.

  1. Use -noreflex and a framerate limiter to get flat frametimes and a flat framerate.
  2. Use fps_max 0 and Reflex on to get as many frames as possible, which will result in lower latency.

The only reason you should cap your framerate this way is if you cannot sustain a high enough framerate or your 1% average FPS is too low.

Here is how you implement the NVIDIA framerate limiter.

  1. Open the NVIDIA Control Panel and navigate to Manage 3D Settings.
  2. Click Program Settings.
  3. Find CS2 in the drop-down menu and select it. If you cannot find it, click Add and locate the CS2.exe executable from the Steam directory. It is normally located at: C:\Program Files (x86)\Steam\steamapps\common\Counter-Strike Global Offensive\game\bin\win64\cs2.exe
  4. Scroll down, locate Max Frame Rate, and then select a value.

FPS CAP

Finding this value is relatively easy. Queue up for a competitive match and take note of your average framerate. Pick a value slightly below your average framerate. For example, if you average 280 FPS, lock the framerate to 250 FPS. Take note of your new average FPS. This can take some trial and error, so if you are not happy with how things feel, increase or decrease the cap by 10 FPS at a time to dial it in.

Remember to add -noreflex to your launch options and use fps_max 0 inside CS2 when using this limiter.

NVIDIA Scaling for CS2

Simple. If you are playing on a native resolution, use no scaling. If you are playing on a stretched resolution, set scaling to fullscreen and scale on the GPU.

NVIDIA scaling settings for stretched CS2 resolution

CS2 Launch Options

These CS2 launch options are not mandatory, but they can be useful depending on your system and FPS cap setup.

-noreflex only if you use a frame limiter like NVIDIA's or RTSS.

-threads 9 if you have 8 physical CPU cores.

The thread logic is easy: take the number of physical cores you have and add 1.

  • 14900K has 8 P-Cores, so -threads 9.
  • 9800X3D has 8 cores, so -threads 9.

-mainthreadpriority 2 raises the game's main thread to a higher priority. Keep in mind that if you are on an older CPU, this might cause some stuttering.

You can also use no launch options. They are not mandatory.

CS2 Settings

Boot up CS2 and head to the video settings. This section covers the best CS2 settings for FPS while keeping the game playable and readable.

The screenshot below is tuned for performance while still looking decent. You do not have to copy it exactly, but one thing is non-negotiable: always set Dynamic Shadows to ALL. Skipping this actually hurts visibility.

For MSAA, 2X or CMAA2 both work fine. We personally run 4X because our system can handle it and it makes the game look less pixelated.

Best CS2 settings for FPS video settings screenshot

Too Much Work?

Let us tune your system, including Windows and BIOS settings, at fpsheaven.com/services. We recently introduced TinyBoost, our best value-for-money service. Let us take care of your system and help you focus on winning some ELO.

Join the Community

If you have questions about this guide, feel free to join our Discord and ask: https://discord.gg/DjCRn9WTK.

ublockorigin

How to Install uBlock Origin on Chrome in 2026

How to Install uBlock Origin on Chrome Manually

How to install uBlock Origin on Chrome in 2026 is still possible if you manually load the extension from the official release files. This guide shows one fix: downloading the Chromium ZIP, loading uBlock Origin as an unpacked Chrome extension, and launching Chrome with the correct Manifest V2 shortcut flag.

Google has been moving Chrome extensions toward Manifest V3, which can cause the full uBlock Origin extension to stop working, become disabled, or show a message that it is no longer supported. The steps below are for people who still want to use the full uBlock Origin extension on Chrome instead of only relying on the Chrome Web Store.

Before you start, close every Chrome window. This is important because Chrome needs to restart after the policy command and shortcut flag are added.

Step 1: Add the Chrome policy command

Open a Command Prompt window as an administrator. You can do this by searching for Command Prompt, right-clicking it, and selecting Run as administrator.

Paste the following command into the administrator Command Prompt window:

reg add “HKLM\SOFTWARE\Policies\GoogleChrome” /v ExtensionManifestV2Availability /t REG_DWORD /d 1 /f

If the command runs successfully, Windows should show a confirmation message. This command adds a Chrome policy that helps with the uBlock Origin Manifest V2 setup.

If you pasted it correctly, it will look similar to this:

how to install uBlock Origin on Chrome command prompt registry command

Step 2: Download uBlock Origin from GitHub

Close the Command Prompt window and go to the official uBlock Origin GitHub releases page.

On the GitHub page, find the Releases section. The page may show the latest release automatically, or you may need to click into the releases page to see all downloadable files.

uBlock Origin GitHub releases page for Chrome

In the latest release, scroll down until you find the file named CHROMIUM.zip. Click it to download the Chromium version of uBlock Origin for Chrome.

uBlock Origin Chromium ZIP download for Chrome

This will download uBlock Origin as a ZIP file. Locate the downloaded ZIP file on your computer before moving to the next step.

Step 3: Extract the ZIP file

Right-click the downloaded ZIP file and extract it. If you use WinRAR, you can select WinRAR → Extract to…. You can also use the built-in Windows extract option.

Do not try to load the ZIP file directly inside Chrome. Chrome needs the extracted folder, not the compressed ZIP file.

extract uBlock Origin ZIP file for Chrome

Step 4: Load uBlock Origin as an unpacked extension

Open Chrome and go to:

chrome://extensions

Turn on Developer mode if it is not already enabled. Then click the Load unpacked button near the top of the page.

Chrome extensions page Load unpacked button

File Explorer will open. Locate the folder you extracted from the ZIP file. In this example, the folder is inside the Downloads folder.

Click the extracted uBlock Origin folder once, then click Select Folder in the bottom-right corner.

select the extracted uBlock Origin folder in Chrome

You should now see uBlock Origin listed on the Chrome extensions page.

uBlock Origin listed on the Chrome extensions page

Step 5: Create the Chrome shortcut fix

Now you need to close Chrome and create a shortcut with a specific parameter added to the Target field.

Click the Windows search bar and type Chrome. Right-click Google Chrome and select Open file location.

open Google Chrome file location in Windows

This will take you to a folder where Windows stores shortcuts. Locate the Google Chrome shortcut.

Chrome shortcut location in Windows

Right-click the Chrome shortcut and select Properties.

Chrome shortcut properties Target field for uBlock Origin

Now focus on the Target field. Copy the following text:

–disable-features=ExtensionManifestV2Unsupported,ExtensionManifestV2Disabled

Click inside the Target field, move your cursor all the way to the end of the line, press Space once, and then paste the text above.

If Chrome was installed in the default location, your updated Target field should look like this:

C:Program Files\Google\Chrome\Application\chrome.exe” –disable-features=ExtensionManifestV2Unsupported,ExtensionManifestV2Disabled

Click Apply, then click OK. From now on, you should launch Chrome from this edited shortcut so the setting is applied every time.

You can move the shortcut to your desktop by dragging it from the folder to your desktop.

Step 6: Turn uBlock Origin on in Chrome

Launch Chrome using the edited shortcut and go back to:

chrome://extensions

You should see uBlock Origin listed there. If it is turned off, toggle it on.

uBlock Origin enabled on Chrome extensions page